Dashboard
One Control Center.
Every Interaction.
Moderate, publish, analyze, and manage every audience touchpoint — across media platforms and live events — from a single interface.

Everything Flows Through One System
Every widget, event module, and audience interaction connects to the same moderation, analytics, and control layer.
Centralization
All tools and interactions connect to one unified control center — simplifying management and keeping everything aligned.
Scalability
Run one event or hundreds of sessions without added complexity. The system grows with your needs.
Infrastructure Thinking
Built as a structured engagement backbone — reliable, secure, and ready for enterprise-scale operations.
Measure Engagement & Insights
Go beyond surface-level metrics. The Dashboard provides structured, real-time insights into how your audience participates, reacts, and responds — during and after every session or event.
Participation Rates
Track how many attendees actively engage across Q&A, polls, reactions, and posts.
Poll Breakdowns
See instant vote distribution with detailed response segmentation per session or audience group.
Reaction Heat
Visualize emotional intensity and peak engagement moments across timelines.
AI Sentiment Trends
Understand overall audience mood through automated sentiment analysis over time.
Exportable Reports
Generate structured reports for clients, stakeholders, or internal reviews — ready for sharing and post-event analysis.
AI Sentiment Trends
Understand overall audience mood through automated sentiment analysis over time.
Measure Engagement in Real Time
One Control Center. Every Interaction.
Moderate, publish, analyze, and manage every audience touchpoint — across media platforms and live events — from a single interface.
Everything Flows Through One System
Every widget, event module, and audience interaction connects to the same moderation, analytics, and control layer.empowers event organizers and moderators to run smooth, engaging, and safe live events.
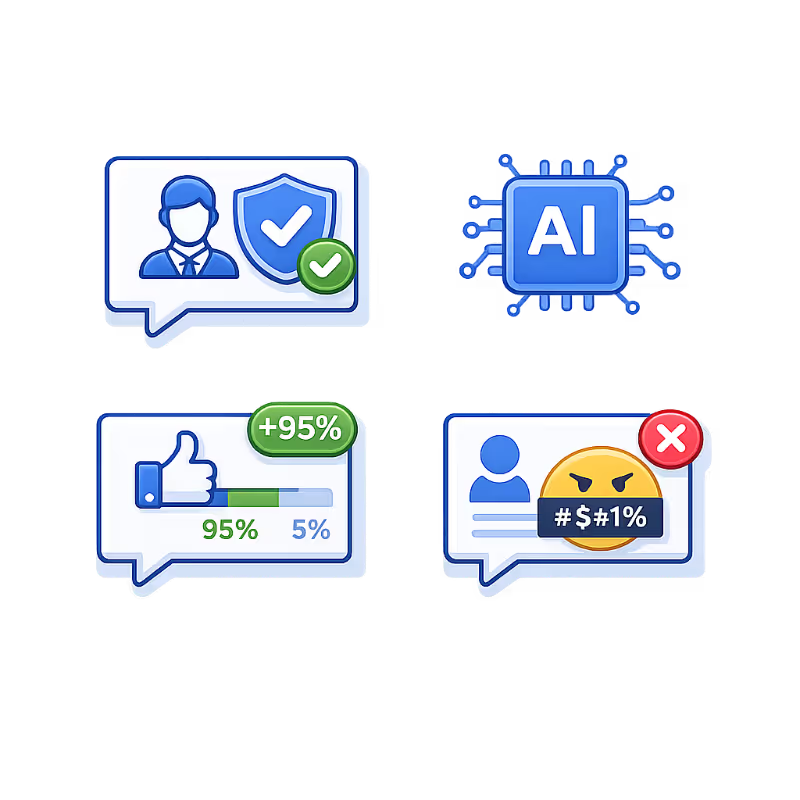
Real-Time Moderation & AI Assistance
Sentiment is an AI-powered analytics layer that continuously monitors audience reactions, chat tone, poll feedback, and participation levels to measure the emotional state of your event.
Profanity & Moderation
An AI-driven moderation system that ensures all your engagement widgets — Chat-W, Reactions, Polling, Live QA, and Wall — remain safe, respectful, and productive environments for participants and organizers.
Scale Without Adding Complexity
Manage multiple brands, events, sessions, and properties from one structured environment.
Canvas
One Container. Unlimited Moments.
Canvas is a dynamic content container that allows you to push different Pubble tools into the same on-page space — without refreshing the page. It transforms a single div into a live engagement surface that evolves throughout your event or coverage.
From the Dashboard, you can control exactly what appears inside the Canvas at any moment.
Canvas keeps audiences focused while giving organizers full control over the engagement experience — all in one structured space.
Manual Control
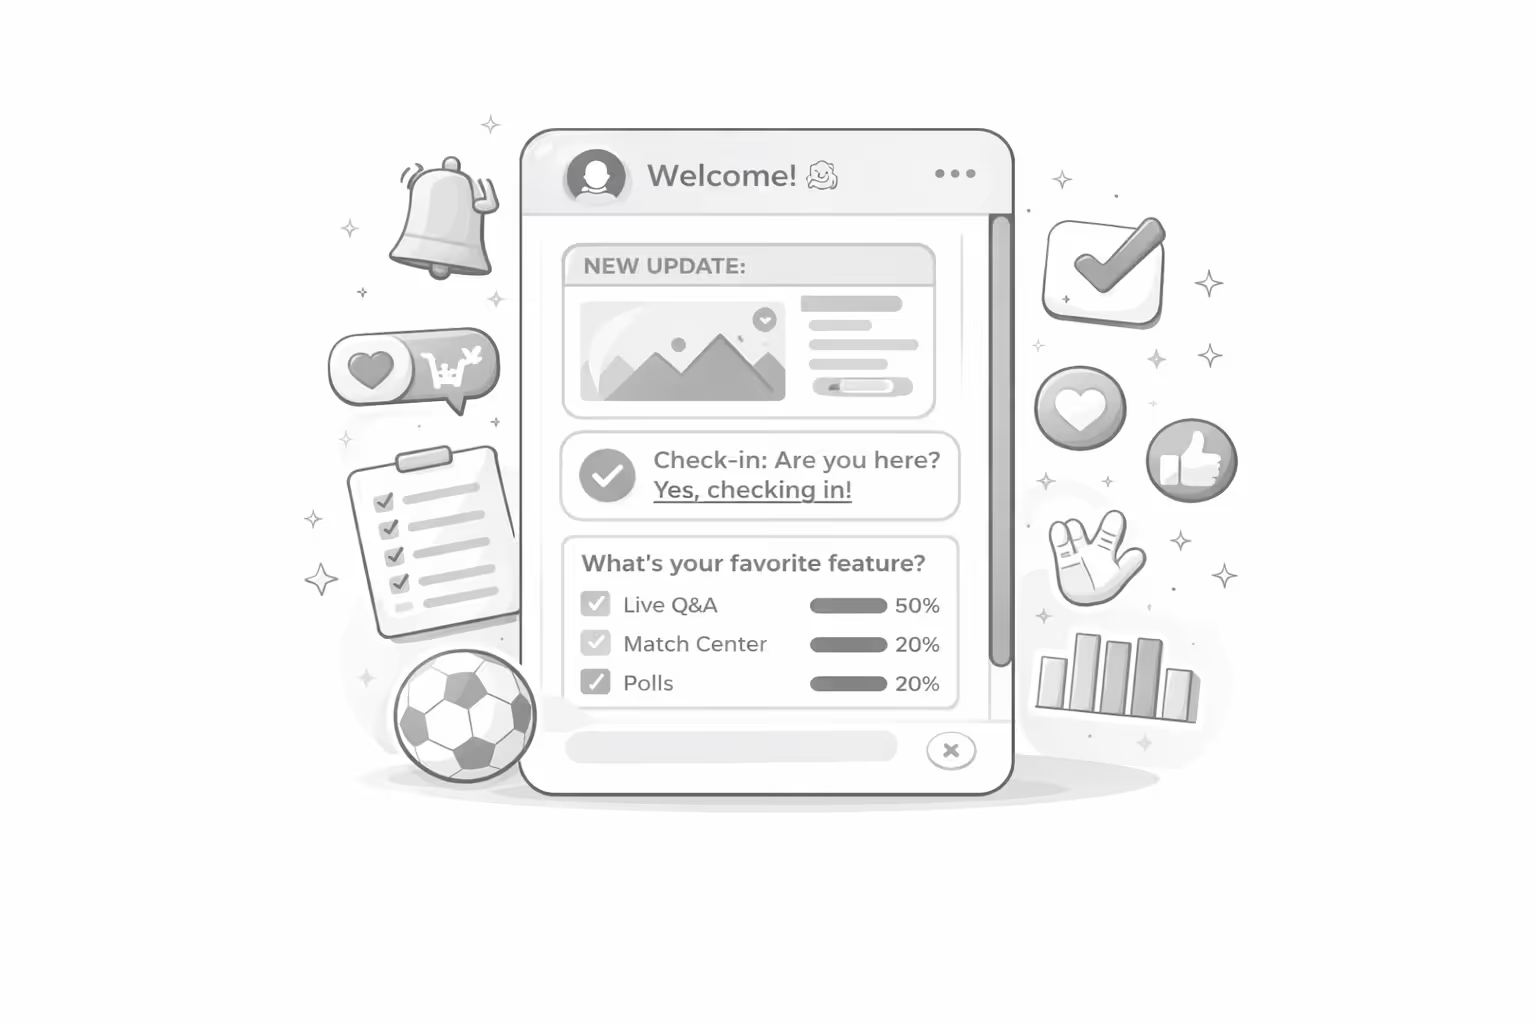
Switch between tools instantly — move from Live Q&A to Polls, Announcements, or Feedback with one click. Perfect for reacting to live discussions or shifting the focus of a session in real time.
Scheduled Transitions
Plan the flow in advance. Schedule which tool appears and when — aligning interaction moments with your event agenda, keynote timing, or editorial timeline.
Built for Enterprise Teams
Designed for organizations that require reliability, governance, and full operational control. The Pubble Dashboard supports structured workflows, team collaboration, and large-scale deployments — without compromising performance or oversight.


One Dashboard. Every Tool Connected.
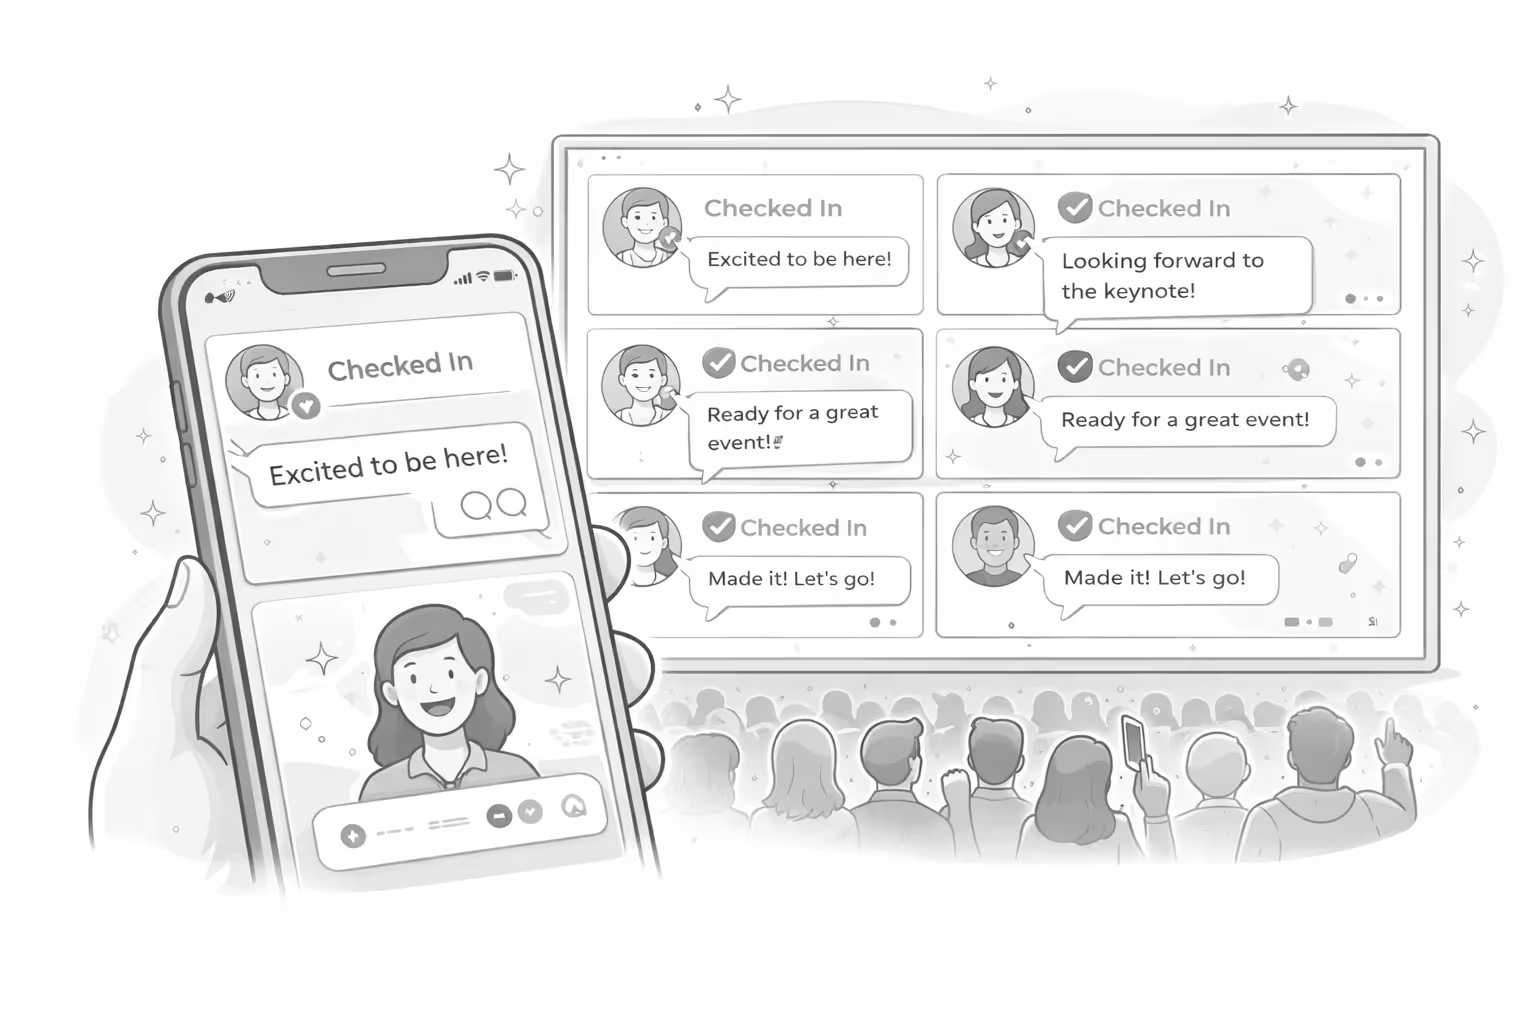
The Pubble Dashboard powers every engagement experience — but each interaction starts with a tool. From Live Q&A and Live Blog to SuperApp, Check-In, and Social Wall, every module connects seamlessly to the same control center.
The Engine Behind Every Pubble Experience.
If engagement happens, it happens through the Dashboard.
FAQs
Get answers to the most common questions about Pubble's Dashboard.
Yes. You can operate multiple events, sessions, or brands in parallel from a single master account, with separate environments and reporting per event.
Yes. You can assign roles such as Admin, Moderator, Publisher, or Analyst, with clearly defined permissions and controlled access levels.
All incoming content flows into a real-time moderation queue. Teams can approve, reject, or highlight items instantly, supported by AI-assisted filtering and keyword rules.
Yes. Tools and content can be triggered manually or scheduled ahead of time, aligning with your event agenda or content timeline.
Yes. From the Dashboard, you can push content to websites, event apps, main stage screens, or session rooms — all synchronized in real time.
The Dashboard provides participation rates, poll breakdowns, sentiment trends, reaction heat maps, session timelines, and exportable reports.
Yes. You maintain full control over your audience data, engagement metrics, and exported reports.
Yes. The infrastructure is built to handle high engagement volumes, large audiences, and multi-day or multi-location events.
Yes. Agencies can create separate environments per client while maintaining centralized operational control.
The interface is designed for intuitive use. With initial onboarding, teams can begin managing sessions, moderation, and analytics quickly — without complex technical setup.
Still have questions?
Our team is ready to provide detailed information and personalized guidance.